

Math has always had a way of turning big ideas into small marks on a page. Probability symbols do exactly that. They let us talk about uncertainty, chance, and data without writing a paragraph every time.
These symbols show up in classrooms, research labs, weather reports, and financial models. Once you understand what each one means, reading a statistics problem feels a lot less like decoding a secret language.
What Do Probability Symbols Symbolize?
At their core, probability symbols represent our attempt to make sense of an uncertain world. Every time you flip a coin, roll a die, or wonder about the weather tomorrow, you are brushing up against probability.
The symbols we use to describe these moments are not just shortcuts. They carry centuries of mathematical thinking and real human curiosity about chance.
Historically, these symbols grew out of Greek and Latin letters chosen by mathematicians who wanted a shared language.
That tradition of borrowing from ancient alphabets connects modern statistics to the scholars of ancient Greece and Rome who first explored logic, measurement, and prediction. Today, these symbols carry that legacy forward every time someone writes out a formula.
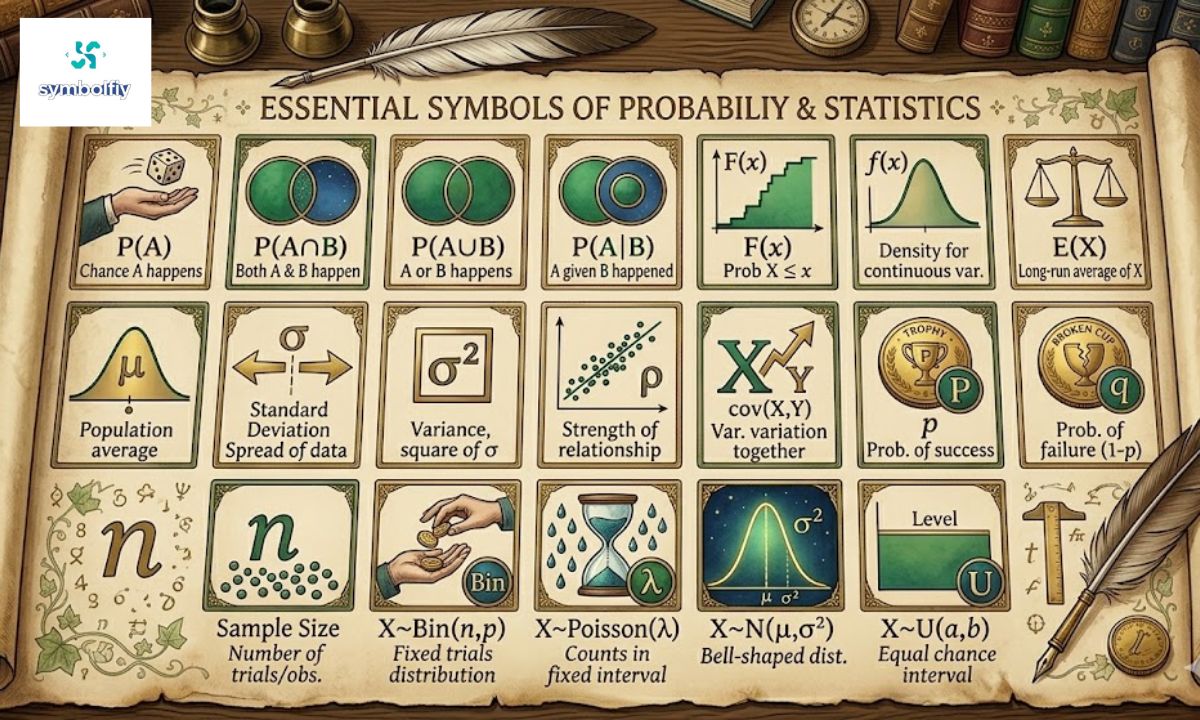
25 Probability Symbols and Their Meanings
1. P(A) — Probability of an Event
- Origin: Introduced in formal notation during the 18th century; the “P” simply stands for probability.
- Meaning: P(A) tells you the likelihood that event A will happen. The value falls between 0 (impossible) and 1 (certain).
- Example: If P(A) = 0.7, event A has a 70% chance of happening.
- Modern use: This is the most fundamental symbol in all of probability. You will see it everywhere from exam problems to scientific papers.
- Emotional resonance: It gives a number to hope and doubt. Every gamble, every forecast, every medical test result starts here.
2. P(Aᶜ) or P(A’) — Complement Probability
- Origin: Developed alongside set theory in the 19th century.
- Meaning: The probability that event A does not happen. Always equals 1 minus P(A).
- Example: If P(rain) = 0.3, then P(no rain) = 0.7.
- Cultural connection: The idea of a complement mirrors concepts in philosophy and Eastern thought — for every outcome, there is its opposite.
- Modern use: Essential in risk assessment and insurance calculations.
3. P(A ∩ B) — Intersection Probability
- Origin: Borrowed from set theory notation developed in the late 1800s.
- Meaning: The probability that both event A and event B happen at the same time.
- Symbol shape: The ∩ symbol looks like a bridge connecting two things together.
- Example: The chance it rains and you forgot your umbrella.
- Practical use: Widely used in decision trees, medical diagnostics, and joint probability models.
4. P(A ∪ B) — Union Probability
- Origin: Also from set theory, paired naturally with the intersection symbol.
- Meaning: The probability that event A or event B happens (or both).
- Symbol shape: The ∪ looks like a cup catching everything from either side.
- Example: The chance it rains or you catch a cold this week.
- Modern use: Used heavily in logic gates, network reliability, and quality control.
5. P(A | B) — Conditional Probability
- Origin: The vertical bar notation became standard through 20th-century statistics texts.
- Meaning: The probability that A happens given that B has already happened.
- Example: P(late | traffic) = how likely you are to be late, knowing there is traffic.
- Emotional weight: This symbol captures how new information changes everything. It is the mathematical version of “now that I know this…”
- Modern use: Core to Bayesian reasoning, spam filters, and medical testing interpretation.
6. E(X) — Expected Value
- Origin: The concept dates to 17th-century gambling theory developed by Pascal and Fermat.
- Meaning: The theoretical average outcome of a random variable over many repetitions.
- Example: If a die is rolled many times, E(X) = 3.5.
- Historical background: Pascal first worked through expected value when advising a nobleman on gambling strategies in 1654.
- Modern use: Central to finance, insurance, and game theory.
7. μ (Mu) — Population Mean
- Origin: Greek letter mu; its systematic use in statistics began with Karl Pearson in the early 1900s.
- Meaning: The true average of an entire population, not just a sample.
- Cultural connection: Greek letters were deliberately chosen to distinguish population values from sample estimates, a tradition that still holds today.
- Example: The average height of all adults in a country.
- Emotional symbolism: Mu represents the “truth” we are always trying to estimate.
8. σ (Sigma) — Population Standard Deviation
- Origin: Introduced by Karl Pearson; sigma was chosen as the Greek equivalent of “s” for spread.
- Meaning: How spread out the values in a population are from the mean.
- Example: A low σ means most values cluster close together. A high σ means they scatter widely.
- Historical note: Pearson’s work in the 1890s laid the foundation for modern statistics, and sigma was central to that system.
- Modern use: Used in quality control, finance (market volatility), and academic research.
9. σ² — Variance
- Meaning: The square of the standard deviation. It measures the average squared distance from the mean.
- Why squared? Squaring removes negative values so distances do not cancel out.
- Example: If σ = 4, then σ² = 16.
- Modern use: Variance is everywhere in data science, from machine learning models to A/B testing.
- Emotional note: Variance quantifies uncertainty. High variance means less predictability.
10. x̄ — Sample Mean
- Origin: The bar notation (read as “x-bar”) became standard notation in the 20th century.
- Meaning: The average of a sample drawn from a larger population. A best guess at the true mean.
- Example: The average score of 30 students on a test.
- Difference from μ: x̄ is what you calculate from data you actually have. μ is the true value you are trying to estimate.
- Modern use: The most commonly computed statistic in everyday data analysis.
11. s — Sample Standard Deviation
- Origin: W.S. Gosset (pen name “Student”) used s in his 1908 paper, and R.A. Fisher later standardized it.
- Meaning: An estimate of how spread out a population is, calculated from a sample.
- Historical note: Gosset worked at the Guinness brewery and needed statistics for small batches, which is why small-sample methods bear his name.
- Example: The spread of test scores in a classroom compared to the national average.
- Modern use: Used in nearly every scientific study that draws from a sample.
12. F(x) — Cumulative Distribution Function (CDF)
- Meaning: Gives the probability that a random variable X is less than or equal to a value x.
- In plain terms: F(x) = P(X ≤ x).
- Historical background: The CDF became a standard tool in the early development of mathematical statistics in the 1920s and 30s.
- Example: The probability that a randomly chosen adult is shorter than 6 feet.
- Modern use: Critical in modeling, simulation, and statistical software.
13. f(x) — Probability Density Function (PDF)
- Origin: The notation f(x) was refined by Leonhard Euler in the 18th century.
- Meaning: Describes the relative likelihood of a continuous random variable taking a given value.
- Key point: For continuous variables, you never get the probability of one exact value — you integrate the PDF over a range.
- Example: The bell curve that shows how heights are distributed across a population.
- Modern use: Used in virtually every area of science that deals with continuous measurements.
14. N(μ, σ²) — Normal Distribution
- Origin: First described by Abraham de Moivre in 1733; later developed by Gauss.
- Meaning: Describes data that clusters symmetrically around a mean in a bell-shaped curve.
- Cultural connection: The normal distribution shows up so often in nature — heights, test scores, measurement errors — that it became known as the “Gaussian” curve after Carl Friedrich Gauss.
- Example: X ~ N(0, 1) means X follows a standard normal distribution.
- Spiritual parallel: Many cultures describe balance and harmony as a central ideal. The normal distribution is mathematics saying the same thing.
15. ~ (Tilde) — Distributed As
- Meaning: The tilde (~) means “follows the distribution of.”
- Example: X ~ N(0, 1) means X is normally distributed with mean 0 and standard deviation 1.
- Origin: This notational convention grew out of the need to describe random variables cleanly in the 20th century.
- Modern use: Appears in every statistical model and machine learning paper written today.
- Simple analogy: Think of it as a label telling you what kind of randomness you are dealing with.
16. ρ (Rho) — Population Correlation
- Origin: Karl Pearson introduced rho for correlation in the 1890s; R.A. Fisher helped standardize it.
- Meaning: Measures the strength and direction of the relationship between two variables in a population. Ranges from -1 to +1.
- Example: ρ close to 1 means as one variable rises, the other does too.
- Cultural note: Greeks used rho (ρ) as the 17th letter of their alphabet; its adoption in statistics continued the tradition of borrowing Greek characters for universal mathematical language.
- Modern use: Fundamental in finance, social science research, and data analysis.
17. cov(X, Y) — Covariance
- Meaning: Measures how much two random variables change together. Positive means they move in the same direction; negative means opposite.
- Difference from correlation: Covariance is in the original units of measurement. Correlation is standardized.
- Example: High covariance between study time and test scores makes intuitive sense.
- Historical context: Covariance was developed as part of Pearson’s broader work on multivariate statistics in the late 19th century.
- Modern use: Central to portfolio theory in finance and multivariate statistics.
18. Bin(n, p) — Binomial Distribution
- Origin: The binomial theorem goes back to the work of Pascal and Newton in the 17th century.
- Meaning: Describes the number of successes in a fixed number of independent trials, each with the same probability p.
- Example: The number of heads in 10 coin flips follows Bin(10, 0.5).
- Historical background: Pascal’s triangle, known to Persian and Chinese mathematicians centuries earlier, underpins this distribution.
- Modern use: Used in quality testing, clinical trials, and A/B testing.
19. Poisson(λ) — Poisson Distribution
- Origin: Named after French mathematician Siméon Denis Poisson, who described it in 1837.
- Meaning: Models the number of times a rare event happens in a fixed interval of time or space.
- Example: The number of emails you get in an hour, or accidents at an intersection per month.
- Historical note: Poisson originally applied it to wrongful convictions in French courts, making it one of the first uses of statistics for social justice.
- Modern use: Widely used in telecommunications, biology, and reliability engineering.
20. χ² (Chi-Square) — Chi-Square Distribution
- Origin: Developed by Karl Pearson in 1900 as a test for goodness of fit.
- Meaning: Used to test whether observed data fits an expected distribution, or whether two categorical variables are independent.
- Example: Testing if a die is fair by comparing observed rolls to expected frequencies.
- Cultural connection: Chi (χ) is the 22nd letter of the Greek alphabet, carrying the Greek tradition of using ancient letters as universal scientific shorthand.
- Modern use: One of the most widely used tests in social science, medical research, and genetics.
21. Z — Standard Score (Z-Score)
- Meaning: Measures how many standard deviations a data point is from the mean. Calculated as (x – μ) / σ.
- Example: A Z-score of 2 means the value is 2 standard deviations above average.
- Historical context: The standard normal table based on Z-scores became a staple of statistics education in the 20th century.
- Practical use: Used in college admissions (SAT scores), medical tests, and any situation where you compare across different scales.
- Emotional note: A Z-score tells you how “normal” or “unusual” something is — a deeply human question.
22. Ω (Omega) — Sample Space
- Origin: The use of capital Omega for sample space is traced to Andrei Kolmogorov’s foundational axioms of probability published in 1933.
- Meaning: Represents the complete set of all possible outcomes of an experiment.
- Cultural connection: Omega is the last letter of the Greek alphabet, making it symbolically fitting as a container for all possible outcomes. In Christian tradition, God is described as “the Alpha and the Omega” — the beginning and the end.
- Example: For a coin toss, Ω = {Heads, Tails}.
- Modern use: Foundational in probability theory and formal logic.
23. ∅ — Empty Set
- Origin: Introduced into mathematics in the 20th century from set theory, associated with the work of Bourbaki group mathematicians.
- Meaning: Represents an event with no outcomes — something that cannot happen.
- Example: Rolling a 7 on a standard 6-sided die. The event has no outcomes, so it belongs to ∅.
- Spiritual parallel: The concept of nothingness or the void appears across Buddhist philosophy and Taoist thought, where emptiness carries its own meaning.
- Modern use: Used to define mutually exclusive events and impossible outcomes in probability models.
24. H₀ — Null Hypothesis
- Origin: The concept of the null hypothesis was formalized by R.A. Fisher in the 1920s.
- Meaning: The default assumption that there is no effect, no difference, or no relationship between variables.
- Example: “This new drug has no effect” is a typical null hypothesis.
- Historical significance: Fisher’s formalization of hypothesis testing transformed how science is done. Nearly every modern scientific study tests a null hypothesis.
- Modern use: Core to clinical trials, psychology research, economics, and data science.
25. p-value — Probability Value
- Origin: Also introduced by R.A. Fisher as a way to measure evidence against the null hypothesis.
- Meaning: The probability of getting results at least as extreme as the observed data, assuming the null hypothesis is true. A small p-value (usually below 0.05) suggests the result is statistically significant.
- Example: p = 0.03 means there is only a 3% chance of seeing these results if the null hypothesis were true.
- Cultural impact: The p-value has become one of the most debated and widely misunderstood concepts in modern science.
- Modern use: Used in virtually every field that involves data analysis and research.
Ancient Cultures That Used These Symbols
The history of probability symbols stretches back further than most people expect. Here are the traditions that helped shape the language of chance and data:
Ancient Greek culture: Greek scholars like Pythagoras and Archimedes built the foundation of mathematical thinking. The Greek alphabet became the default source for mathematical symbols, which is why μ, σ, ρ, χ, and Ω all come from Greek letters.
Egyptian and Mesopotamian traditions: These civilizations were among the first to use systematic notation for counting, measurement, and prediction. Their work on tally marks and positional numeral systems laid early groundwork for statistical thinking.
Arab scholars: Mathematicians like Al-Khwarizmi in the 9th century advanced algebra and logical reasoning. The word “algebra” itself comes from Arabic — al-jabr, meaning the reunion of broken parts.
17th-century French mathematics: Blaise Pascal and Pierre de Fermat laid the direct foundations of probability theory in 1654 through their correspondence about gambling problems. The expected value symbol E(X) traces directly to their work.
19th-century British statistics: Karl Pearson, Francis Galton, and R.A. Fisher built the modern framework of statistical symbols in Britain between the 1880s and 1930s, formalizing μ, σ, r, and hypothesis testing notation.
Eastern philosophical traditions: While not directly tied to the symbols, Buddhist and Taoist concepts of emptiness (the void, ∅), balance (the normal curve), and interdependence (correlation, covariance) echo themes that probability mathematics formalized independently.
Why Symbols Still Matter Today
We live in a world flooded with data. Every click, purchase, test result, and news headline comes loaded with statistics.
Probability symbols are the shorthand that lets researchers, doctors, engineers, and analysts communicate precisely and efficiently. Without them, science would move at a crawl.
But these symbols matter beyond the classroom too. They show up in the conversations we have about risk — should I take this medication? Is this neighborhood safe? What are the odds this investment pays off?
Understanding even the basics of probability notation helps you ask better questions and read the world more clearly. In that sense, learning these symbols is not just an academic exercise. It is a tool for living with less confusion and more confidence.
Frequently Asked Questions
What is the most commonly used probability symbol?
P(A) is the most fundamental — it represents the probability of any event and appears in virtually every probability problem.
What does the vertical bar mean in P(A | B)?
The vertical bar means “given that.” P(A | B) reads as “the probability of A given that B has already occurred.”
Where do probability symbols come from?
Most come from the Greek alphabet, adopted by European mathematicians in the 17th through early 20th centuries to create a universal mathematical language.
What is the difference between μ and x̄?
μ is the true population mean — often unknown. x̄ is the sample mean you calculate from data you actually have.
What does a p-value of 0.05 mean?
It means there is a 5% chance of seeing your results (or more extreme results) if there is truly no effect. It is a common threshold for calling a result statistically significant.
Conclusion
Probability symbols are more than classroom notation. They are the result of centuries of human effort to put numbers on uncertainty, to say something precise about a world that refuses to sit still. From Pascal’s gambling tables to Pearson’s population studies to Fisher’s hypothesis tests, each symbol carries a story. Learn them, and you get more than a formula — you get a way of thinking.


